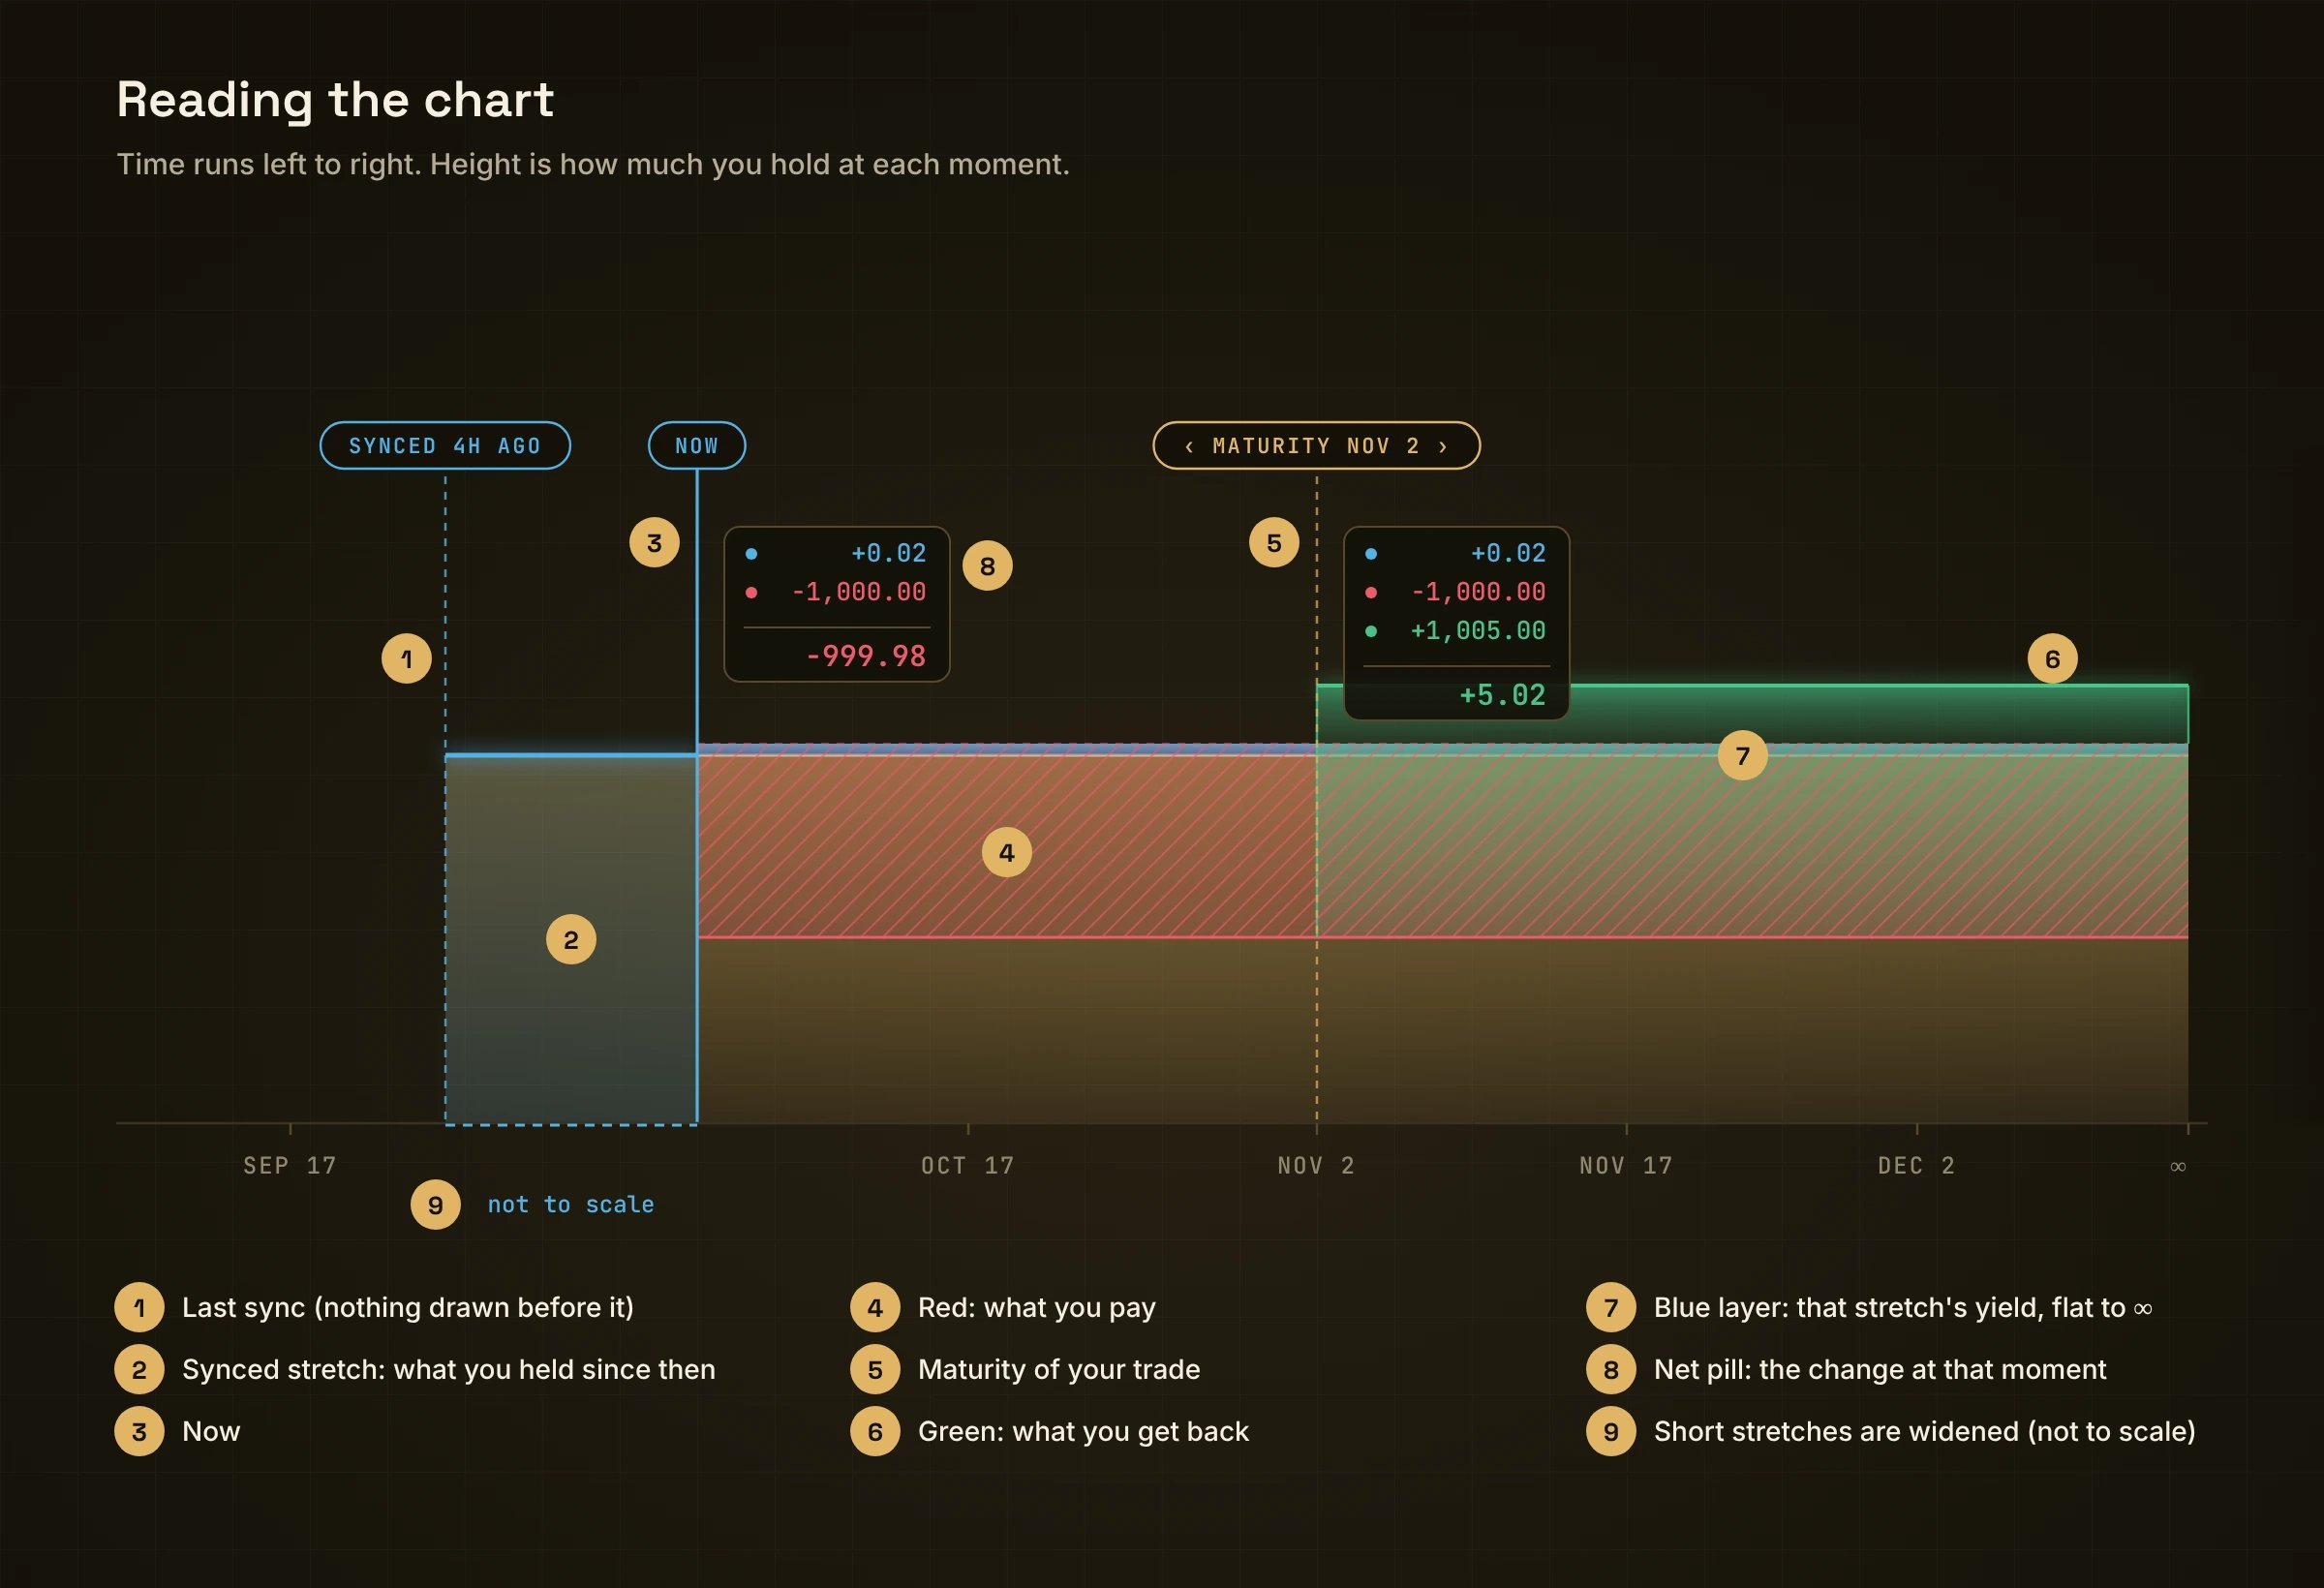
Every page in the app shows the same chart: your money over time. Learn it once and you can read every screen.
Annotated chart: last synced, synced stretch, Now, gold balance, blue yield, red cost, green gain, maturity, infinity, not to scale
Red and green sit in front of the gold and blue. The blue strip never moves with a trade.

Lines and labels

Drag the chart, or use ‹ Now ›, to move through time.

Sync
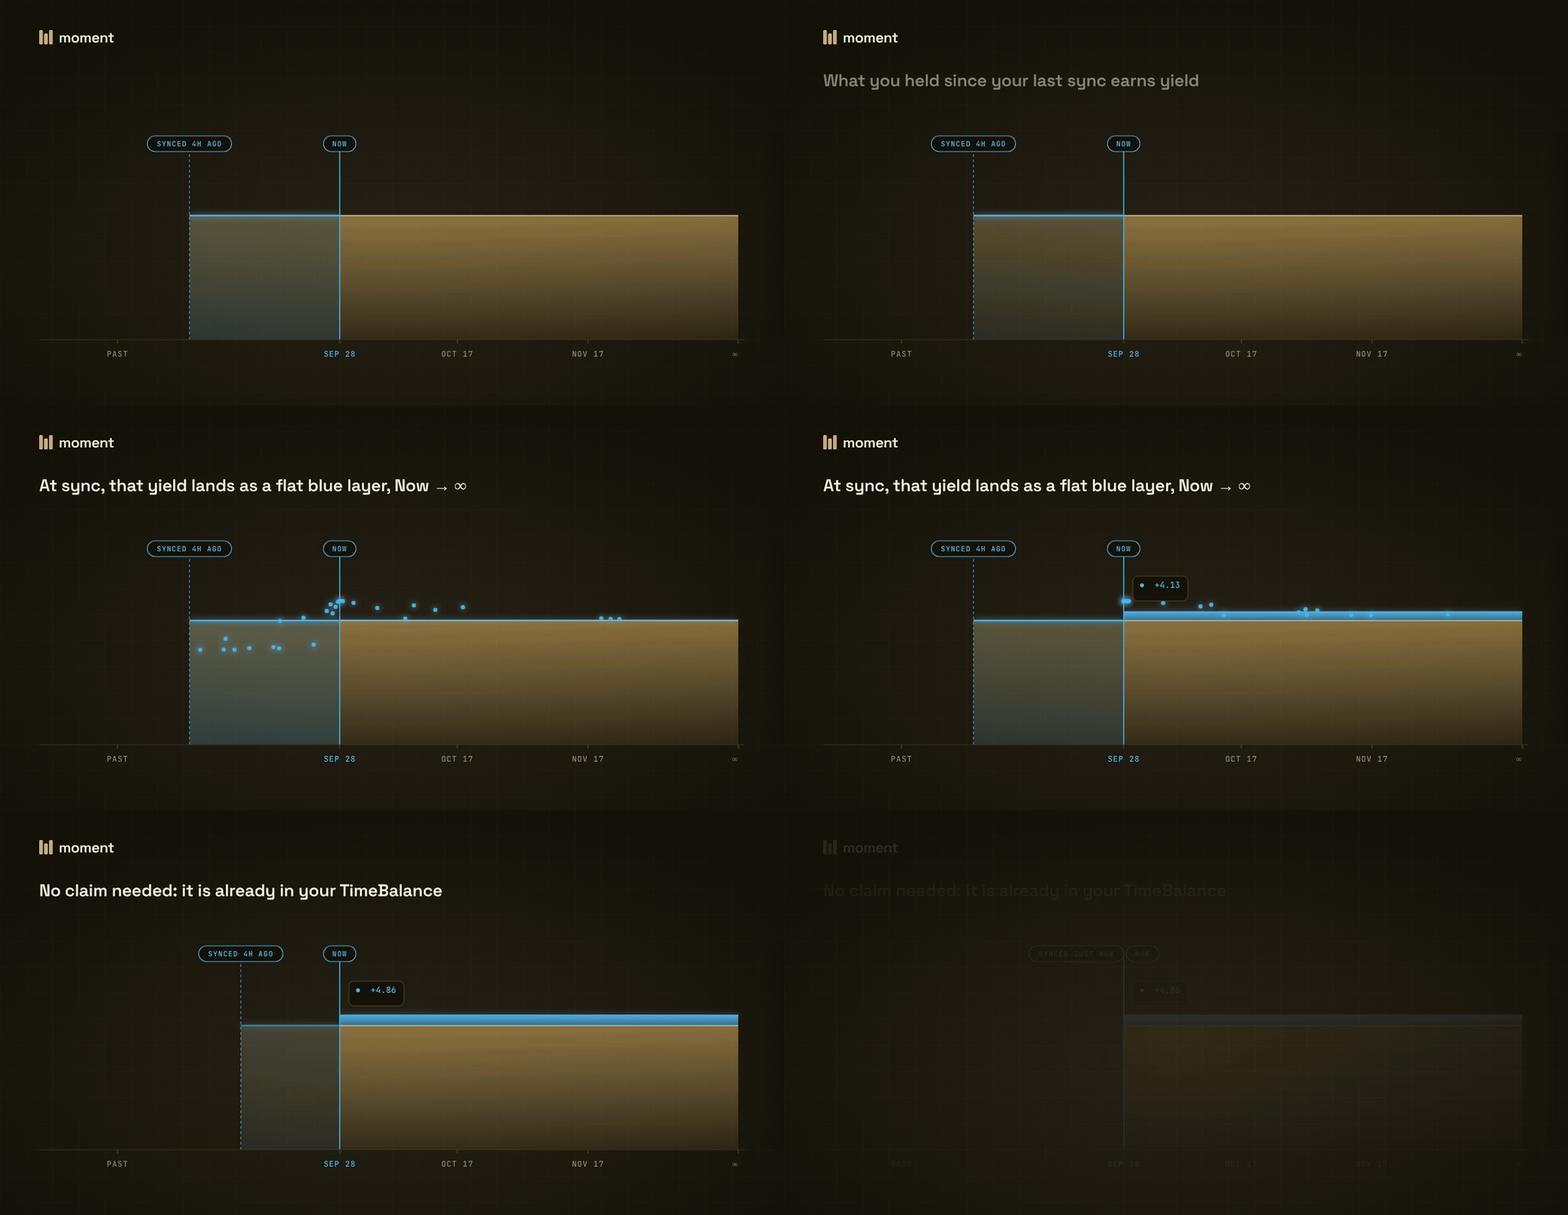
The box held since the last sync earns yield, which lands as a flat blue layer from Now to infinity

At sync, the yield you earned becomes a flat layer from Now to ∞.

Any action syncs your position: a trade, a close, adding or removing liquidity. The yield you see is already after the 5% performance fee.

Markets, dates and rates

Each market is one yield-bearing coin. It has a calendar of maturities. In the example market they fall on the 2nd and 17th of every month at 08:00 UTC, with 8 open at a time. The gap between two maturities is a period, and each period has its own rate.
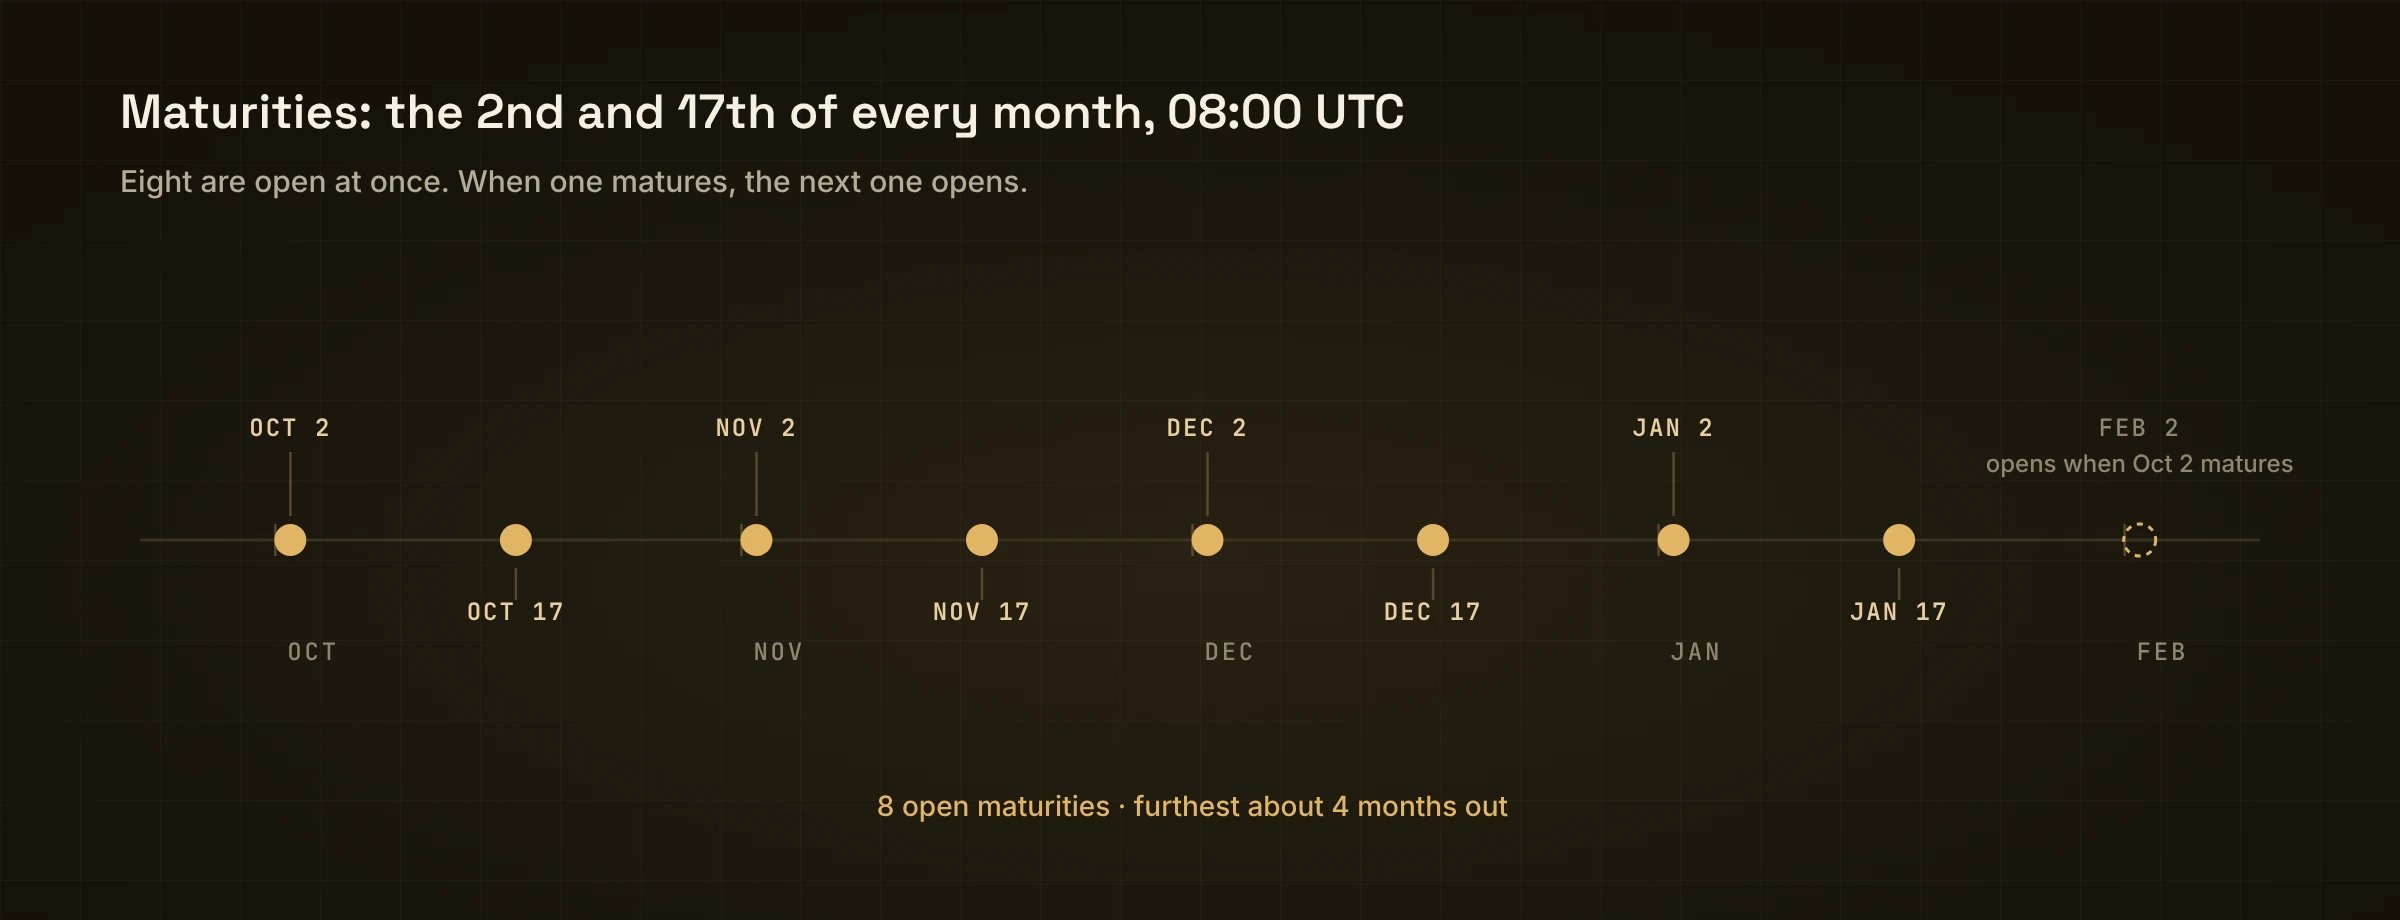
A calendar with maturities on the 2nd and 17th and 8 open maturities rolling forward

Maturities on the 2nd and 17th. Eight are open at once; a new one opens as one passes.

On the Markets page you can see each market as:
  • Overview: one row per market, with a fixed rate and the date it runs until, its liquidity and your position.
  • Forward: the rate of each period.
  • Term: the rate to fix from Now until each date.
Every rate reads the same way. Give up x of your line until a date, and get x × rate × days ÷ 365 more from that date on. Across several periods, each period is priced on its own rate and the results chain, so the exact total is a touch above this estimate. The app shows the exact figure. For example, 1,000 at 5.21% for 35 days gives about 5 more. When a maturity passes, nothing expires. Your line just keeps going.
Last modified on November 3, 2026